


















































What are Pew and NTTO?
Pew Research Center surveyed about 1,000 adults in each country in 2026. It asked whether they had “a lot” or “some” confidence in President Donald Trump to do the right thing in world affairs (Pew Q10a) and whether they had a favorable opinion of the United States (Pew Q3a). Confidence is not the same as approving of every policy or voting support.
NTTO, the US National Travel and Tourism Office, records international visitor arrivals to the US by the visitor’s country of residence. It counts arrivals, not unique people, and includes trips of all kinds, not just holidays.
Important: the adults Pew surveyed are not necessarily the people who travelled to the US.
Quick summary
- We compared ten European countries. Those where more adults expressed confidence in Donald Trump tended to record stronger changes in visitor arrivals to the US between January–August 2024 and 2026. The correlation was 0.89.
- Countries where more adults viewed the United States favorably showed a similar pattern. The correlation was 0.89.
- Views of Trump and views of the US were closely linked (correlation 0.97). They cannot be treated as separate signals.
- This comparison looks at countries, not individual travellers. It does not show that political views caused changes in travel. July–August 2026 arrivals are preliminary.
Key findings
-
Primary result
Where confidence in Trump was higher, arrivals to the US held up better
Across the ten surveyed European countries, higher Trump confidence went together with stronger changes in visitor arrivals to the US (Pearson r = 0.89, Spearman ρ = 0.89, N=10).
-
Second measure
The same pattern appears for views of the United States
Countries with more favorable views of the US also tended to see stronger arrival changes (Pearson r = 0.89, Spearman ρ = 0.89, N=10).
-
Overlap
Views of Trump and of the US are almost the same signal
The two opinion measures correlate at 0.97. Because they move together so closely, the comparison cannot separate a Trump-specific pattern from broader views of the United States.
-
Sensitivity
The pattern weakens, but remains, without Hungary and Poland
Removing the two growth markets lowers Trump confidence to r = 0.77 and US favorability to r = 0.73 (N=8).
-
Range among the ten
Changes ranged from Hungary +19.0% to Germany −23.9%
Arrivals from residents of Hungary recorded the largest percentage rise of the ten; arrivals from residents of Germany the largest percentage decline.
Trump confidence and arrival change
Each dot is one country. Countries further right had higher published confidence in Trump; countries higher up recorded stronger arrival changes from 2024 to 2026.
Confidence in Trump vs % change in visitor arrivals to the US, Jan–Aug 2024 → Jan–Aug 2026
−30%−20%−10%0%+10%+20%0%10%20%30%40%50%Confidence in Trump regarding world affairs, 2026 (% of adults)HungaryPolandUKGreeceSpainItalySwedenFranceNetherlandsGermany
Ten surveyed European countries: Pearson r = 0.89, Spearman ρ = 0.89 (N=10). Without Hungary and Poland: r = 0.77, ρ = 0.78 (N=8). Equal country weights; no trend line is drawn. Sources: Pew Research Center 2026; NTTO ADIS/I-94, country of residence.
A strong association — not an explanation
In this panel, the ordering is consistent enough to be notable: countries with higher confidence in Trump generally sat higher on the arrival-change scale. But there are only ten countries, and each is a single national figure. The survey describes adults across each country, while arrivals count trips by residents, many of whom may not resemble the average survey respondent.
The opinion measures also overlap heavily. Trump confidence and US favorability correlate with each other at r = 0.97 across the ten countries, so they are not independent confirmations. The comparison cannot tell whether any pattern is specific to Trump or reflects broader attitudes toward the United States.
Country contrasts
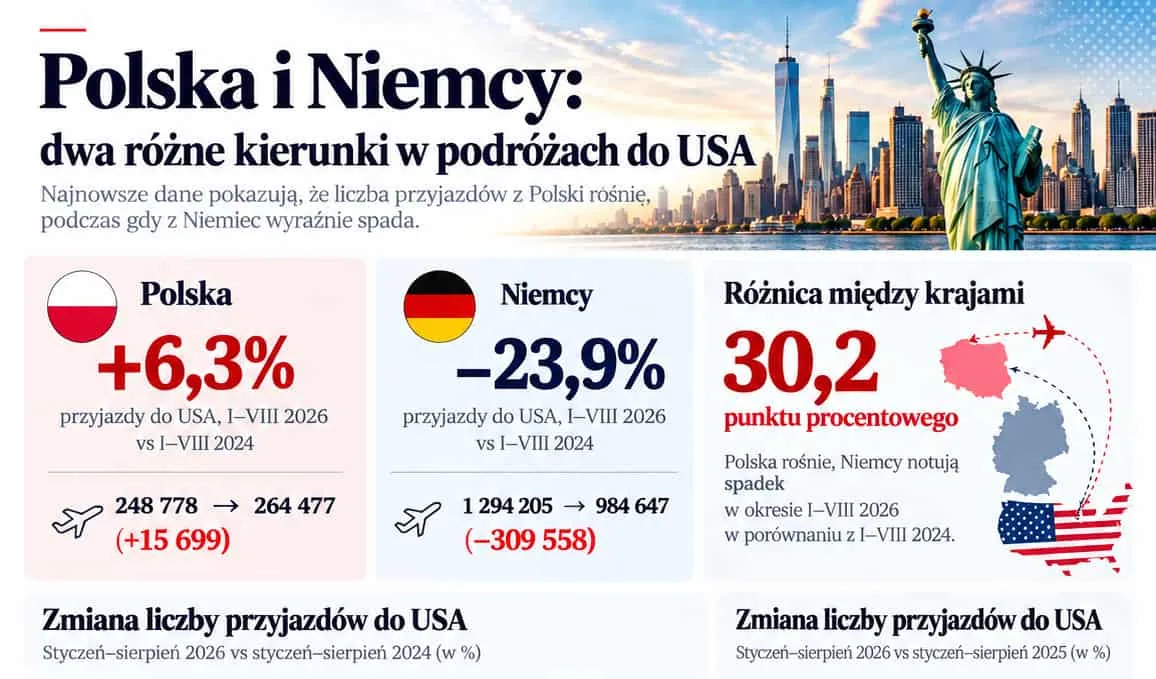
Hungary and Poland combine relatively higher opinion readings with arrival growth. Arrivals from residents of Hungary rose +19.0% (57,536 to 68,463), with 58% US favorability and 44% Trump confidence; Hungary is a medium-size NTTO market. Poland rose +6.3%, with 49% and 29%. Neither has majority confidence in Trump.
The relationship is not deterministic. Sweden has lower readings than Germany (19% favorable and 11% confidence, against 27% and 16%), yet a smaller decline: −13.3% against −23.9%. Greece has low Trump confidence (22%) but arrivals nearly unchanged at −0.2%. Arrivals from the United Kingdom were slightly above their 2024 level (+1.5%) despite 26% Trump confidence. France and Germany share the same published US favorability (27%) but recorded different declines, −20.2% and −23.9%.
US favorability and arrival change
US favorability vs % change in visitor arrivals to the US, Jan–Aug 2024 → Jan–Aug 2026
−30%−20%−10%0%+10%+20%0%10%20%30%40%50%60%Favorable opinion of the United States, 2026 (% of adults)HungaryPolandUKGreeceSpainItalySwedenFranceNetherlandsGermany
Ten surveyed European countries: Pearson r = 0.89, Spearman ρ = 0.89 (N=10). Without Hungary and Poland: r = 0.73, ρ = 0.79 (N=8). Equal country weights; no trend line is drawn. Sources: Pew Research Center 2026; NTTO ADIS/I-94, country of residence.
What this analysis cannot tell us
This comparison shows which countries moved together. It cannot show why. In particular:
- It is an ecological comparison: country averages cannot show what individual travellers thought or why they travelled.
- Ten countries is a small sample; one or two countries can shift the result.
- Many other differences between countries are not measured here, and none is tested.
- Timing is context only. January–August 2024 falls before Donald Trump’s second term and January–August 2026 during it, but the 2024 baseline does not start at his January 2025 inauguration, and the difference does not measure the effect of any administration.
Complete ten-country data
Sorted by percentage change in arrivals. Opinion values are published Pew national percentages; arrivals are NTTO January–August totals by country of residence.
| Country of residence | Jan–Aug 2024 | Jan–Aug 2026 | Change | % change | US favorable | Trump confidence | US reliable partner |
|---|---|---|---|---|---|---|---|
| Hungary | 57,536 | 68,463 | +10,927 | +19.0% | 58% | 44% | 65% |
| Poland | 248,778 | 264,477 | +15,699 | +6.3% | 49% | 29% | 57% |
| United Kingdom | 2,590,065 | 2,628,714 | +38,649 | +1.5% | 41% | 26% | 49% |
| Greece | 57,295 | 57,167 | −128 | −0.2% | 37% | 22% | 48% |
| Spain | 597,674 | 583,194 | −14,480 | −2.4% | 30% | 21% | 31% |
| Italy | 756,667 | 712,377 | −44,290 | −5.9% | 31% | 17% | 34% |
| Sweden | 192,679 | 167,142 | −25,537 | −13.3% | 19% | 11% | 31% |
| France | 1,160,172 | 925,622 | −234,550 | −20.2% | 27% | 15% | 27% |
| Netherlands | 421,483 | 330,740 | −90,743 | −21.5% | 25% | 15% | 41% |
| Germany | 1,292,854 | 983,296 | −309,558 | −23.9% | 27% | 16% | 39% |
Does the pattern hold if countries are removed?
The Hungary and Poland exclusion is the weakest pairwise result for both main measures. “US as a reliable partner” is shown here only: it is materially less robust, falling sharply when those two countries are removed.
| Measure | All ten (r / ρ) | Without Hungary & Poland (r / ρ) | Leave-one-out r range |
|---|---|---|---|
| Trump confidence | 0.89 / 0.89 | 0.77 / 0.78 | 0.83–0.92 |
| US favorability | 0.89 / 0.89 | 0.73 / 0.79 | 0.80–0.92 |
| US reliable partner | 0.76 / 0.69 | 0.41 / 0.38 | 0.60–0.84 |
Opinion intercorrelations: favorability and Trump confidence 0.97; favorability and reliable partner 0.91; Trump confidence and reliable partner 0.88.
Attributed 2026 travel-industry context
The comparison sits alongside wider travel-industry discussion in 2026. Reuters reported a September 2 meeting between Trump and travel-company executives at which issues including visa waits, fares, entry rules, tariffs and restrictions were discussed. U.S. Travel’s May forecast anticipated 3.4% full-year international-arrival growth, while NTTO’s archived Spring 2026 forecast anticipated 3.2%. These are attributed discussions and full-year expectations, not variables tested in this analysis or explanations established for the country pattern.
Key data for journalists
- Sample: ten surveyed European countries (N=10), equal country weights.
- Trump confidence vs arrival change, Jan–Aug 2024 → 2026: r = 0.89, ρ = 0.89.
- US favorability vs arrival change: r = 0.89, ρ = 0.89.
- Without Hungary and Poland (N=8): r = 0.77 (Trump confidence) and 0.73 (US favorability).
- Largest rise among the ten: Hungary +19.0% (+10,927 arrivals). Largest decline: Germany −23.9% (−309,558).
- Descriptive, country-level comparison; it does not show causes or traveller motives. July–August 2026 arrivals are preliminary.
- Sources: Pew Research Center, 2026 national adult opinion; NTTO ADIS/I-94, country of residence, January–August arrivals; Destination Finder analysis of the frozen match.
Methodology and limitations
Ten European countries appear in both Pew’s 2026 survey and the NTTO arrivals data. Correlations use published opinion percentages and unrounded NTTO percentage changes, with each country weighted equally. Results are descriptive and non-causal.
Full methodology

All Inclusive
Luksusowy kwartalnik turystyczno-podróżniczy. Od 2004 roku opisujemy miejsca, do których warto lecieć dłużej niż na weekend, i ludzi, którzy je prowadzą.